Two decorators. Then every run leaves a record.
onetrace wraps the code you already have. Each step writes a receipt as it runs; you verify the record, compare two runs, and browse them in the console. No platform, no account, and nothing sent anywhere.
Install and run
From zero to a verified run.
This follows the quickstart: a two-step pipeline, a retriever and an answer. New to Python, or to onetrace? Get started walks through every step, from installing Python to your runs in the console.
Install
The verifier, onetrace-verify, comes with it.
pip install onetrace
Decorate your steps
@ot.stage on each step, naming the tool that does the work. @ot.run on the function that does the whole job once. Change nothing else.
import onetrace as ot

@ot.stage("retrieve", instrument=ot.pkg("word-overlap", "onetrace",
                                         kind="retriever", config={"top_k": 2}))
def retrieve(question):
    ...

@ot.stage("answer", instrument=ot.pkg("first-passage", "onetrace", kind="model-call"))
def answer(question, passages):
    ...

@ot.run(stages=["retrieve", "answer"])
def main():
    ...
Run it as usual
The run writes a folder under runs/, named by its run id, and prints the command that checks it. onetrace doctor checks your setup.
python app.py
onetrace doctor
Switch it off, or take it out
ONETRACE_DISABLE=1 makes both decorators pass straight through and nothing is written. To remove it, delete the import and the decorator lines; your code runs as before.
ONETRACE_DISABLE=1 python app.py
Verify
Check a run without trusting the code that wrote it.
onetrace-verify uses only the Python standard library and needs no network. It prints one row per check, PASS, FAIL or NOT-RUN, then a result. With --require-artifacts it also checks every output file.
onetrace-verify --require-artifacts runs/<run id>
| Exit code | Meaning |
|---|---|
0 | PASS: every check that ran held. |
1 | FAIL: something in the record doesn't match, and the row says where. |
2 | NOT VERIFIED or refused: for example a format version the verifier doesn't implement, or an unreadable manifest. Nothing is reported as passing. |
Runs can also be signed with an Ed25519 key you hold, or anchored with an outside timestamp. Both sit beside the record and change none of its bytes. See the manual.
Compare runs
Ask "what changed?" and get one verdict per step.
diff verifies both runs first, then walks them step by step. localize names the first point of divergence and its cause. --text shows the output text that changed.
onetrace diff runs/<run A> runs/<run B>
onetrace diff runs/<run A> runs/<run B> --text
onetrace localize runs/<run A> runs/<run B>
| Step verdict | Meaning |
|---|---|
same | The step's output digest matches. |
FIRST DIFFERENCE | The first step, in order, whose output differs. |
downstream | Still different after the first difference. |
reconverged | Different work upstream, same output here. |
COULD NOT CHECK | Can't be evaluated. Never read as a pass. |
diff result | Exit code |
|---|---|
| identical | 0 |
| diverged | 1 |
| not comparable | 2 |
| refused | 3 |
| could not check | 4 |
The exit codes make it easy to gate a CI job on a comparison against a known-good baseline run.
The console
Browse your runs in a browser.
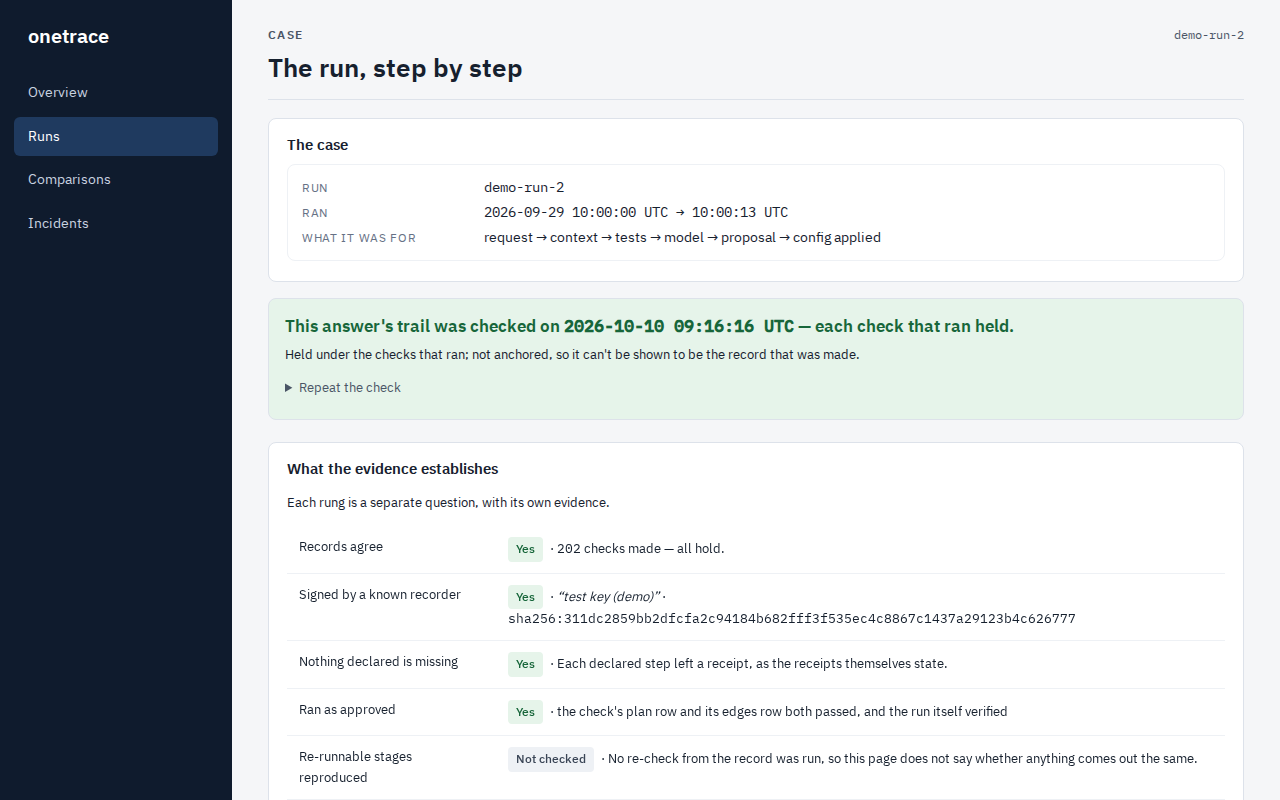
The onetrace console reads your run folders and draws the pages you saw on the demo: an overview, one page per run, and comparisons with the first difference marked. It runs on your machine.
pip install onetrace-console
onetrace-console demo
It needs Python 3.12 or later. demo copies two sample runs into onetrace-console-demo/, compares them, and prints the pages' addresses. Then point it at your own runs:
onetrace-console runs/
onetrace-console runs/ --compare <run A> <run B>
onetrace-console runs/ --open
Every folder holding a MANIFEST.json is loaded; one still being recorded is skipped, with the reason. --compare takes two folder names, the first as the baseline. It listens on 127.0.0.1 only, port 8080 unless you pass --port, and makes no network calls. The console's README has every option, and how to run it for a team.
With your coding agent
Let your coding agent add onetrace for you.
The agent recipe is written for the agent, not for you. You hand it over; the agent follows it, asks you what only you can answer, and reports back with test, verify and diff results.
1. Open your project in the agent
Claude Code, Cursor, GitHub Copilot, Windsurf, Cline, Codex or any agent that can edit your repository.
2. Paste this prompt
Or install the kit's file for your tool, below, and run it as a command.
3. Answer its questions
What one run is, how to treat an external index, the trust fields it leaves unset on purpose, and signing. Then read its report.
4. Open your runs in the console
Every run your program makes from now on lands in a runs folder. See them in your browser with the commands below.
Instrument this repository's Python pipeline with onetrace.
Read the recipe in full first: https://oneproof.dev/onetrace/agents/instrument.md
(the raw file, not a summary). Follow sections 0 to 7 in order. Add recording only:
results must stay exactly the same. Stop and ask me wherever the recipe says to ask.
Never put a secret in a decorator or config. Finish with the report from section 7,
and tell me the exact commands to run my program and open its runs in onetrace-console.
| Tool | Kit file to copy into your project | Then |
|---|---|---|
| Claude Code | .claude/commands/onetrace-instrument.md | Type /onetrace-instrument |
| Cursor | .cursor/rules/onetrace-instrument.mdc | In Agent chat: follow @onetrace-instrument |
| GitHub Copilot (VS Code, agent mode) | .github/prompts/onetrace-instrument.prompt.md | Type /onetrace-instrument |
| Windsurf | .windsurf/rules/onetrace-instrument.md | In Cascade: @onetrace-instrument |
| Cline | .clinerules/onetrace-instrument.md | Ask it to instrument the repository with onetrace |
Codex and other agents that read AGENTS.md | AGENTS.md (merge the section into yours) | Ask it to instrument the repository with onetrace |
| Any other agent | PROMPT.txt | Paste it as your message |
If your agent can't fetch web pages, save instrument.md in your project as docs/onetrace/instrument.md; every kit file tells the agent to look there. Keep the AGENTS.md or CLAUDE.md section afterwards: it keeps later agent edits consistent with the instrumentation.
See your own runs in the console
Once onetrace is in your code, each run of your program writes a folder under runs, in the folder you start it from. In the same environment you run your program in:
pip install onetrace-console
onetrace-console --version          # must say 0.1.0 or later
onetrace-console runs --open
runsis the folder that holds your run folders; a full path works too, for exampleonetrace-console "C:\Users\you\my-app\runs" --open. Every run folder in it is loaded and listed on the Overview; one still being recorded is skipped, with the reason.- To compare two runs, add their folder names:
--compare <first> <second>. Tip: name runs as you record them, withONETRACE_RUN_ID=before(PowerShell:$env:ONETRACE_RUN_ID = "before"), so you can write--compare before after. - The console reads the folder when it starts. After new runs, stop it with Ctrl+C and run the command again.
- Port 8080 already in use? Add
--port 8091. If--versionshows 0.0.0, or the console prints commands such asadmin create, an older install answered first: make a fresh virtual environment and install there, as in Get started.
Guides for your setup
Pick the page that matches your project.
You don't need any of these to start: Get started is enough. Open one when it matches your situation. The four "worked examples" are the same small question-answering pipeline, built four ways, each recorded with onetrace, so you can see where the decorators go in code like yours.
Plain Python
The pipeline written with no framework at all: read documents, split them, find the relevant parts, write an answer. Read this if your code is ordinary Python functions. It is also the reference the other three are compared with.
Read → Worked exampleLangChain
The same pipeline built with LangChain's loaders, splitters and chains, with each step recorded as a stage. Read this if your project uses LangChain.
Read → Worked exampleLlamaIndex
The same pipeline built with LlamaIndex's readers, index and retriever. It shows which steps LlamaIndex covers and which stay plain Python. Read this if your project uses LlamaIndex.
Read → Worked exampleLangflow
The same pipeline with its steps run as Langflow components, and the record saying which steps Langflow ran. Read this if you build flows in Langflow.
Read → For your coding agentAgent recipe
Step-by-step instructions written for an AI coding tool, not for you to follow. Your agent reads it and adds onetrace to your code. Use it through the agent kit, higher up this page.
Read → When something stopsErrors and fixes
Every message onetrace can stop with, what caused it, and a one-line fix. Open it when a run or a check prints an error you don't understand.
Read →Want to know exactly what's in a receipt?
The next layer down: the record format, the hash chain, how the verifier decides, and what each verdict does and doesn't mean.